Channels Report
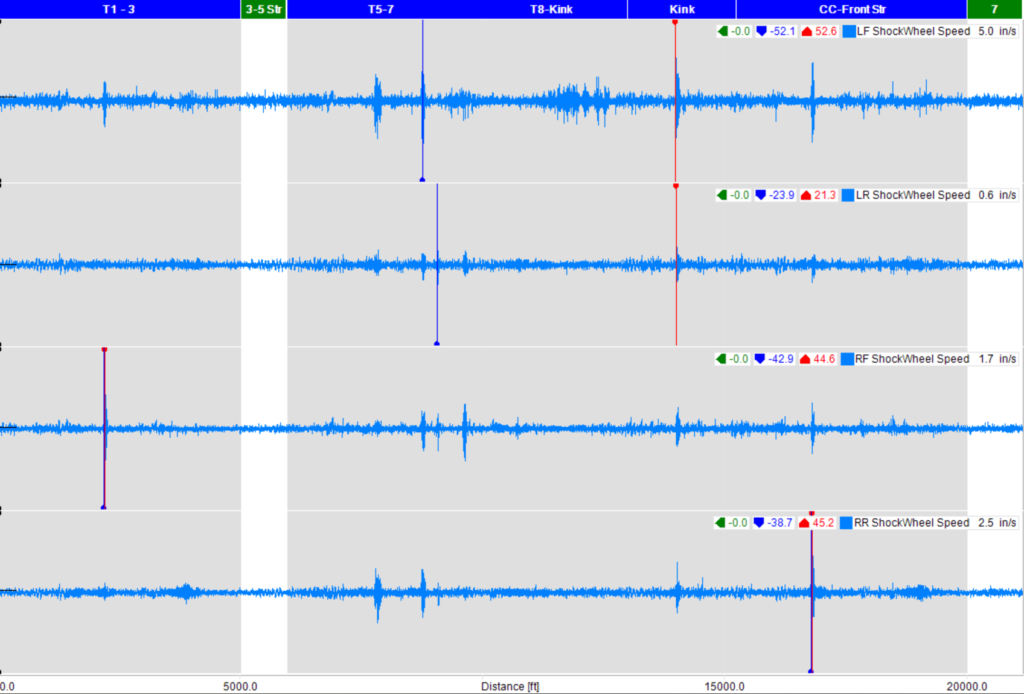
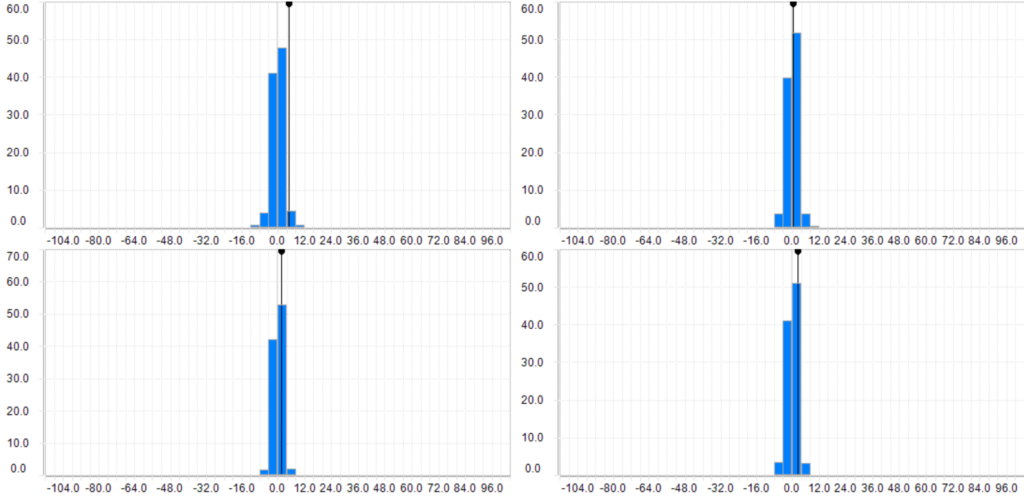
Shocks
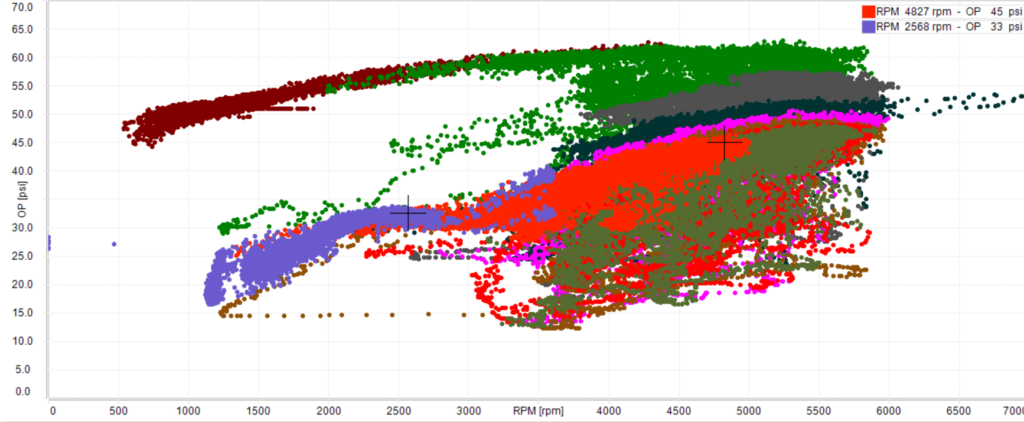
Oil
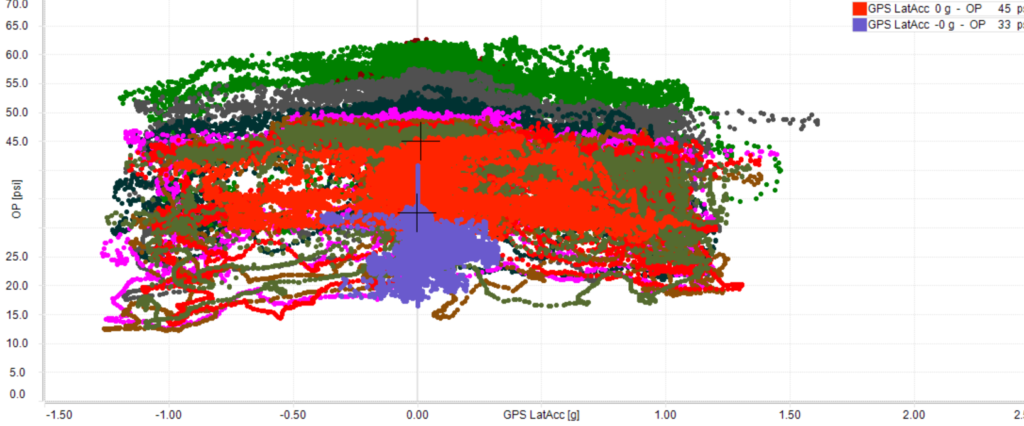
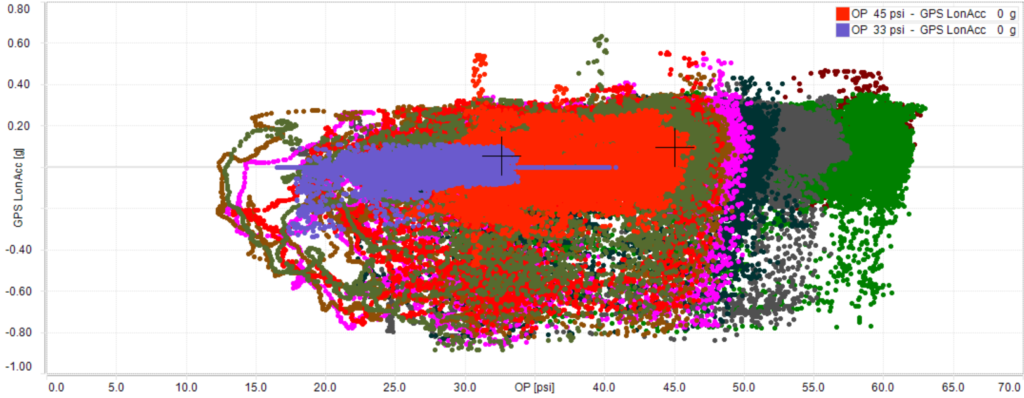
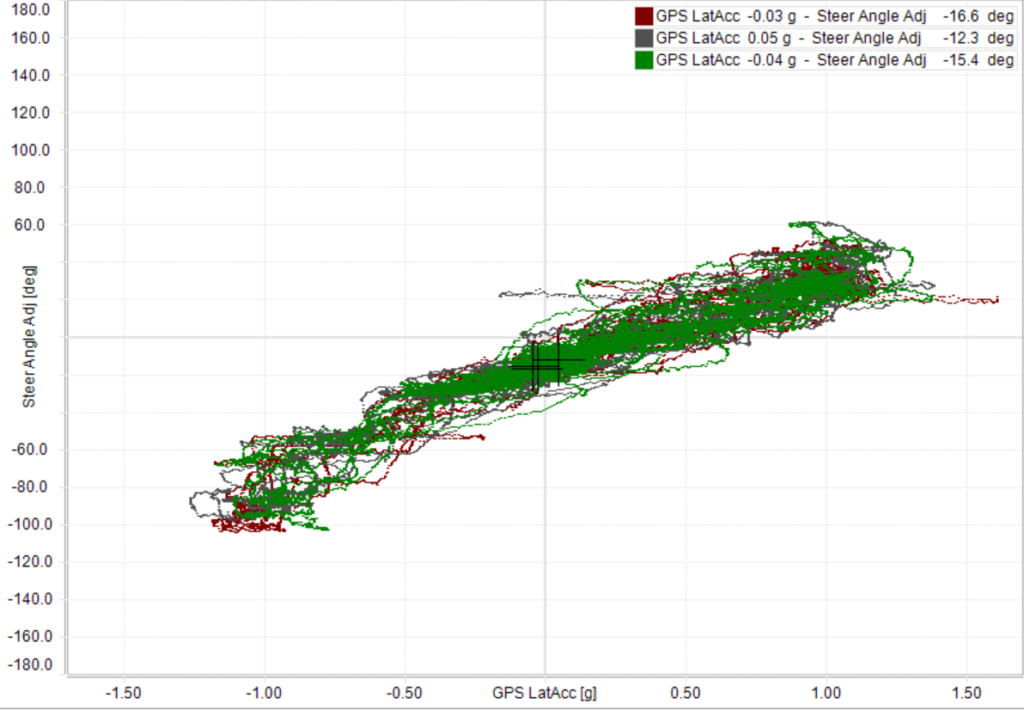
Oversteer/Understeer
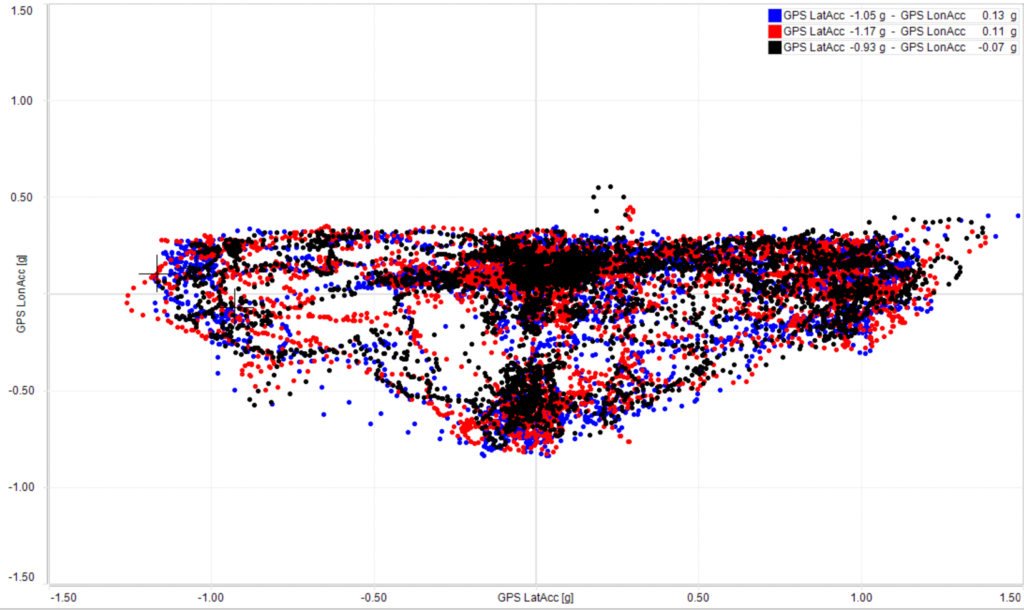
Lateral and Longitudinal G
There is a persistent vehicle dynamics challenge. The car can exhibit nearly 1.2 lateral g forces in both left and right turns, which is quite good, but the car can only consistently exhibit about .8 longitudinal negative g (braking). This is likely the result of having extremely high front brake bias, which is being used to keep the rear of the car settled under heavy braking. With less front brake bias (more even between front and rear) the rear of the car gets quite unsettled under heavy braking; however, with less front brake bias there is an opportunity for all four brakes to help slow the vehicle versus just the front two brakes.
I need to reduce front brake bias to see if that will help increase braking capability but I need to be careful not to go to far and induce rear instability or I need to accept rear instability.
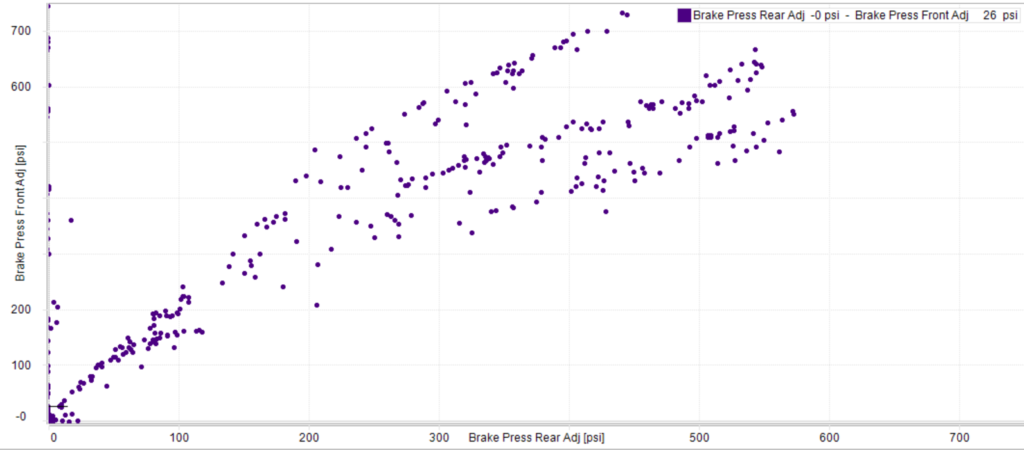
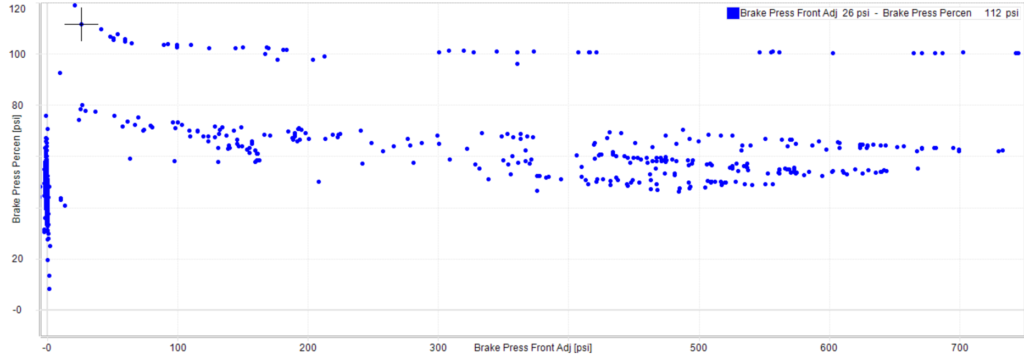
Brake Pressure
This is very strange. The first figure show the rear versus the front brake pressure. There is normally some variation is pressure between the two but this data shows quite a bit. In essence, the influence of the front brakes to the rear brakes changes all the time. The second figure shows the fronts account for between 50 and 70 percent…again, varying quite a bit over time. There are also readings above 100 percent but I think this is an anomaly because it occurred between T3 and T5 when no brake would be applied.