One of the eternal questions that floats throughout the paddock is “What camber should my car have?” Even within the big Healey community there are nearly as many different answers to this question as there are people who set up big Healeys. Some of the answers seemed to be informed by folklore, as if the information was cast upon us late at night by a spirit figure. Some of the answers seemed to be informed by experience. Other opinions were just being passed on by other racers. None of this instilled a great deal of confidence in my desire to find “the camber” setting, so I set out on this little journey.
What Are We Doing? Why Are We Doing This?
Why do all this…well, to go around corners faster and have lower lap times. Practically, we want to have the face of a tire (fronts only in our case because we cannot adjust the rears) evenly contact the track surface in a corner because this will allow for the greatest contact patch size between the tire and track, thus allowing the greatest g-force and speed around a corner. If an outside tire has too little negative camber in a corner, it is primarily using the outside edge of the tire. If the outside tire has too much negative camber in a corner, it is primarily using the inside edge of the tire. The objective is to use a camber setting that results in an equal amount of use across the tire face. Think Goldilocks…not too much, not too little.
There are plenty of ways to examine this including:
- Setting camber, running some laps, and seeing what the effect is on g-force, speed, and/or lap times…but track time can be expensive.
- Simply looking at tire wear from session to session and hoping to see some informative wear patterns…again, more track time and this isn’t very precise.
- Stick a tire pyrometer into (or use an infrared tire temp gun) the outside edge, inside edge, and middle of a tire as soon as possible after a vehicle exits a track. The challenge here is that the temps across the face of a tire can change rapidly and be quite different by the time measurements are taken.
- Collect data using infrared sensors on the inside of tires (yes, inside the tire) during a session. This results in real-time data that can be coordinated with track location (e.g., straight, corner entry) but WOW, this is spendy.
What Are We Doing? Why Are We Doing This? Part II…The Bonus
An added benefit to measuring tire temperature at three locations across the face of the tire is the ability to determine if a tire is over or under inflated. This can be done by comparing how different a middle temperature reading is from an average of the outside and inside temperature readings. For example, if the middle is hotter than the outside/inside, the tire likely has too much air pressure.
The Solution…Infrared Tire Temp Sensors
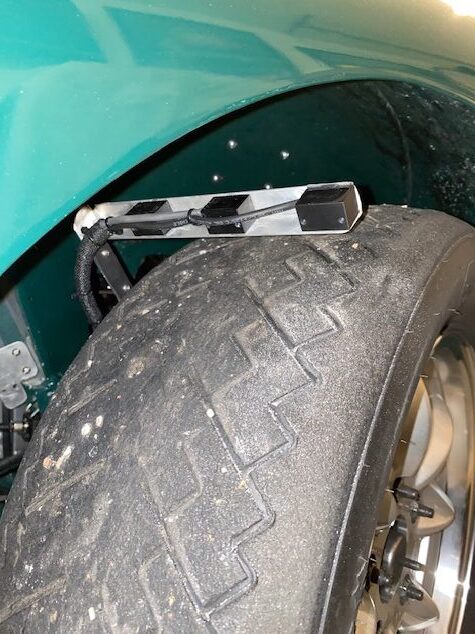
I decided to use three infrared tire temperature sensors with one aimed at the outside edge, one at the middle, and one at the inside edge of a tire. The assembly is mounted to hub so that the IR sensors are always at the same distance from the tire and move with the tire (hub) as I turn the steering wheel and as the wheel moves up and down over the track.
These sensors are relatively inexpensive and are connected to my data system so that I get real time data. It is important to note that no approach is perfect. Tire surface temperature changes fast which may obfuscate true temperature readings, but this was the approach that best balanced cost, convenience, and ability to answer my main question.


Caveats
Of course there are a few caveats. First, while my measurements may help you out to some degree, I would encourage a bit of caution in applying my results to your car because there are many factors that may impact tire temperatures, how they change, how stable they are, etc. My results may only be applicable to my racecar.
Second, it may be that even if a process is followed by which we adjust camber and tire pressure to get a consistent reading across the contact patch of the tire during a corner, this may not be a camber that is perfect for all corners. Racing is all about compromises and an optimal setting for one type of corner may not be the best setting for the rest of a track.
At this stage I have been gathering and reading documents that can help inform the direction of the investigation (see some below but also see Jorge Segers book “Analysis Techniques for Racecar Data Acquisition”), mounting the IR sensors, and setting up the math channels and graphs in Race Studio 3. In May I will be collecting data while on track.
First Round of Data Collection
IR tire temp data was collected May 17 and 18, 2024 at Road America with the data shown below collected on May 18 in the mid-morning. IR sensor data was collected from the inner edge (~1.25″ from the side), outer edge (~1.25″ from the outside), and middle of the tire.
Optimal Tire Temps
The data in the figure below shows the average of the three temperatures that was associated with the absolute value of lateral g (essentially the max g obtained for each temp) for the three best laps.
The data indicated the approximate max g was ~1.15 g and it was associated with an average IR temperature between ~120 to ~145 degrees (F). At higher temperatures than 145 degrees, the vehicle was not able to produce the higher g forces. ~120 to ~145 degrees (F) represents the tentative optimal tire temp range.

Camber
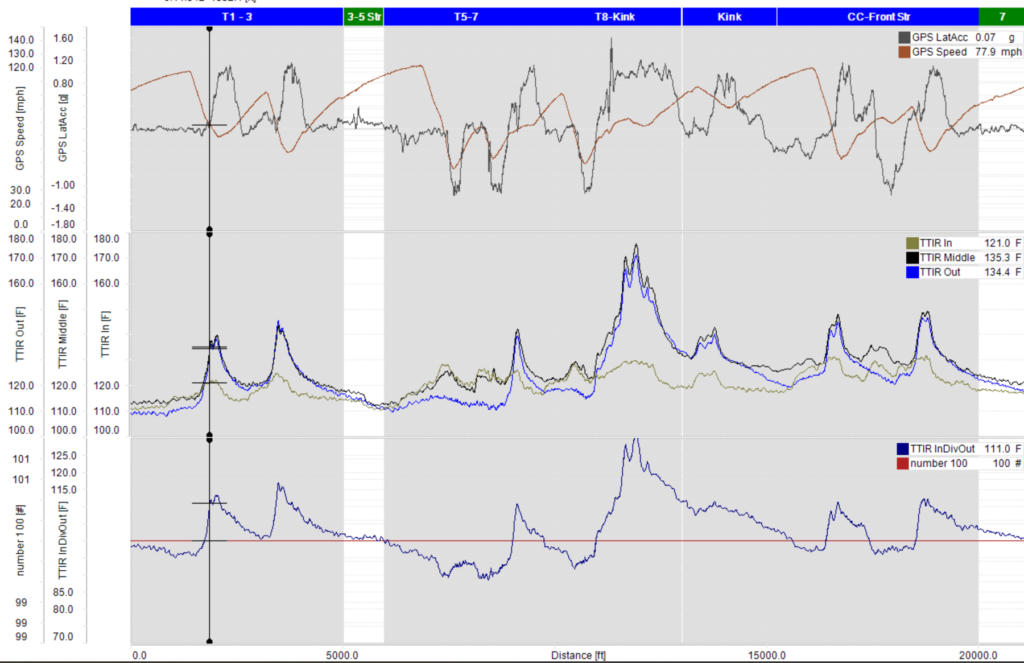
The following figure shows three strips of information, all relate to a single lap around Road America. The top strip shows vehicle speed and lateral acceleration. The middle strip shows the inside, middle, and outside IR tire temperature readings, all for the front left tire and provides a good indication of camber changes that may be needed.
The data from the middle strip indicates that in right hand turns the outside temperatures were generally higher than the inside. During shorter duration curves (T1 and T2) the outside temp was 16 – 20 degrees F higher than the inside while in a prolonged turn (T8 – Kink) there was nearly a 40 degree difference.
The bottom strip visualizes this difference. It shows, as a percentage, how much the outside temperature was greater (greater than 100%) compared to the inside temperature. It would be more ideal if there were roughly equal temperatures across the tire face in turns so that the entire tire face is working equally hard. Collectively, these results indicate there is a need to increase negative camber.

Tire Pressure
This data also provides a good indication of any tire pressure changes that may be needed. The top and middle strips in the following figure present the same information as the prior figure. During right turns, the middle temperature was similar to the outside and higher than the inside. Given that we would expect the middle temp to fall between the inside and outside temps, the data suggest too high a tire pressure.
This is confirmed in the bottom strip of the following figure which compares the middle temperature to the average of the outside and inside temperatures, as a percentage. Greater than 100% indicates the middle temperature was greater than the average of the inside and outside temperatures (the flat line indicates 100% as a reference).

Adjustments
There are other questions that need to be addressed as well. It should be easy to see that camber and tire pressure changes will change performance differently depending on corner type. We could optimize for long slow corners (T8 – Kink), optimize for corners like T1 and T2, or something different. Its a compromise…we cannot optimize for all corner types. I suggest tire pressure (and camber) be optimized for turns that lead to long straights.
Initial Findings
Now to adjust and then retest at the next event. How much does camber and tire pressure need to be adjusted to equalize inner, middle, and outer tire temps during curves so that the tire contact patch on the track surface can be maximized? Joe’s Racing offers some initial direction.
For camber, they suggest “My rule of thumb for adjusting camber is a 1/8” shim for 12 degrees of temp difference between the inside and the outside.” Austin Healeys’ don’t use shims so I will start with .25 degrees camber for each ~10 degrees difference.
For tire pressure, they suggest “…to adjust individual pressures 1 pound for every 5 degrees of over or under inflation shown as hot or cold center temps…”
Second Round of Data Collection
Prior to the July race weekend I adjusted the front left camber from -2.9 to -3.5 degrees and adjusted the front right camber from -2.9 to -3.25 degrees, which is about as far as the front right camber can be changed due to the inability to move that lever shock further inboard (right hand drive steering column gets in the way). I used approximately the same tire pressure in July compared to May.
Camber
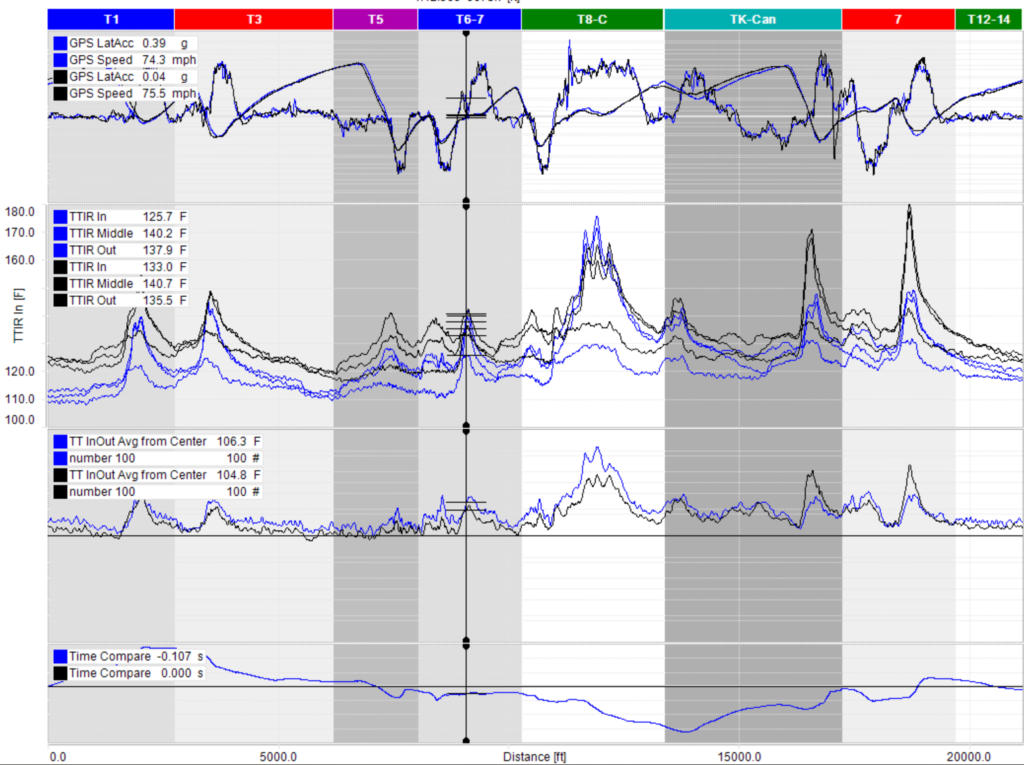
The figure below shows one lap from May (blue) and one lap from July (black), approximately the same lap time. The first strip shows speed and lateral g and the second strip shows the infrared tire temperature for the inside and outside edges and the middle of the left front tire. The third strip shows the relationship between the inside and outside edge as a percentage. Percentages above 100 indicate higher temperatures on the outside compared to the inside edge. The time compare strip is at the bottom and shows how much time the blue lap loses (higher trending line) or gains (lower trending line) compared to the black lap.
The third strip is particularly important right now as it begins to show how the camber change between events impacts the difference between the inside and outside tire temperature. A percentage closer to 100 (represented by the flat black line in that strip) indicates a more equal distribution of tire temperature between the inside and outside tire edges. This is desired as it means the contact patch is working more effectively.
The turn highlighted with the vertical lines is the Carousel. The data show at that specific point there was a 15.8% difference between the May and July events. There are plenty of other factors impacting tire temperatures (e.g., air and track temperatures) so I am certain the differences cannot be solely attributed to increased camber…but that is likely the main factor! Also in July, turns 1 and 2 showed a reduction of ~5% while turn 6 a reduction of ~8%. Interestingly, the turn-in point of Canada Corner and turn 14 showed an increase of ~11%.
Now I will admit this is just one example but the results of increasing negative camber can result in greater temperature equalization across the tire front. In fact, for the Carousel, comparing May to July event results, each additional 1/10th of a degree increase of negative camber was associated with a 2.63% reduction in discrepancy between the inside and outside of the tire face. We can now calculate how much more negative camber would be needed to reduce the % from 15.9% over 100% to 0.

Tire Pressure
The third strip shows the percent the middle temperature was higher than the average of the inside and outside edges. Percentages greater than 100 indicate the middle was hotter than the edges. The data indicate that the tires were a bit overinflated at both events. In addition, the tires were even a bit more overinflated at the July event, likely because the starting pressure was about the same as May but the outside air temperature was markedly higher.

Findings
Our friend Goldilocks is back. We can increase negative camber a little to optimize for turns like 1 and 2 or optimize for different turns like the Carousel. Similarly we can begin to adjust tire pressures down to get closer to even temperatures across the face of the tire. Similarly, tire pressures need to be lowered a little bit regardless, but we could lower them to optimize for turns like 1 and 2, or lower them even more to optimize for turns like the Carousel.
For camber and tire pressure, we need to optimize for turns leading onto long straights so that any benefits can be maximized over longer time periods and speeds.
